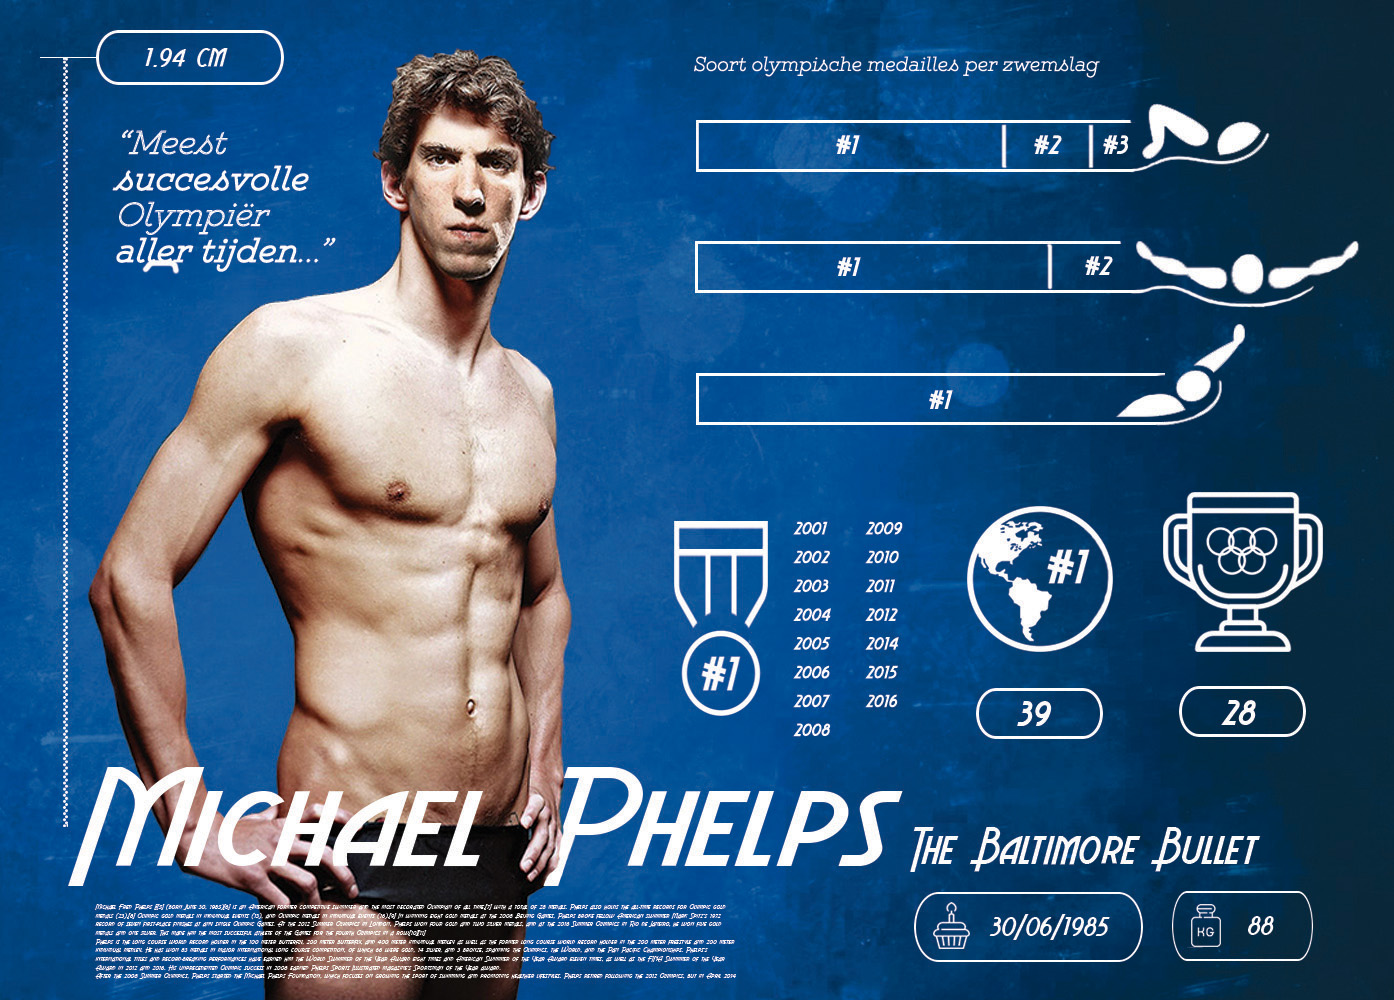
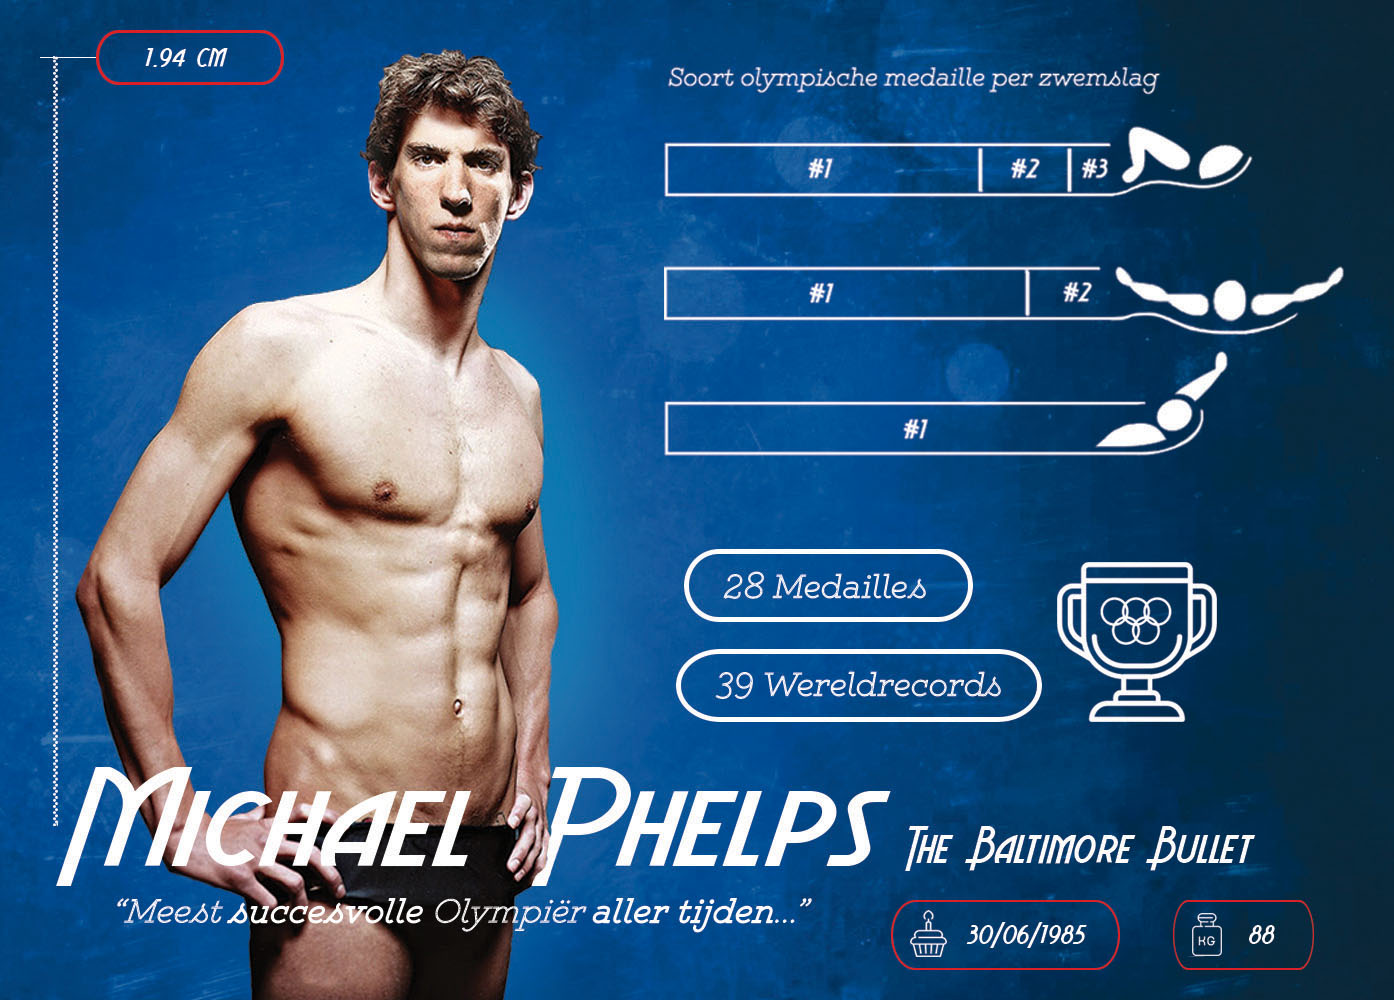
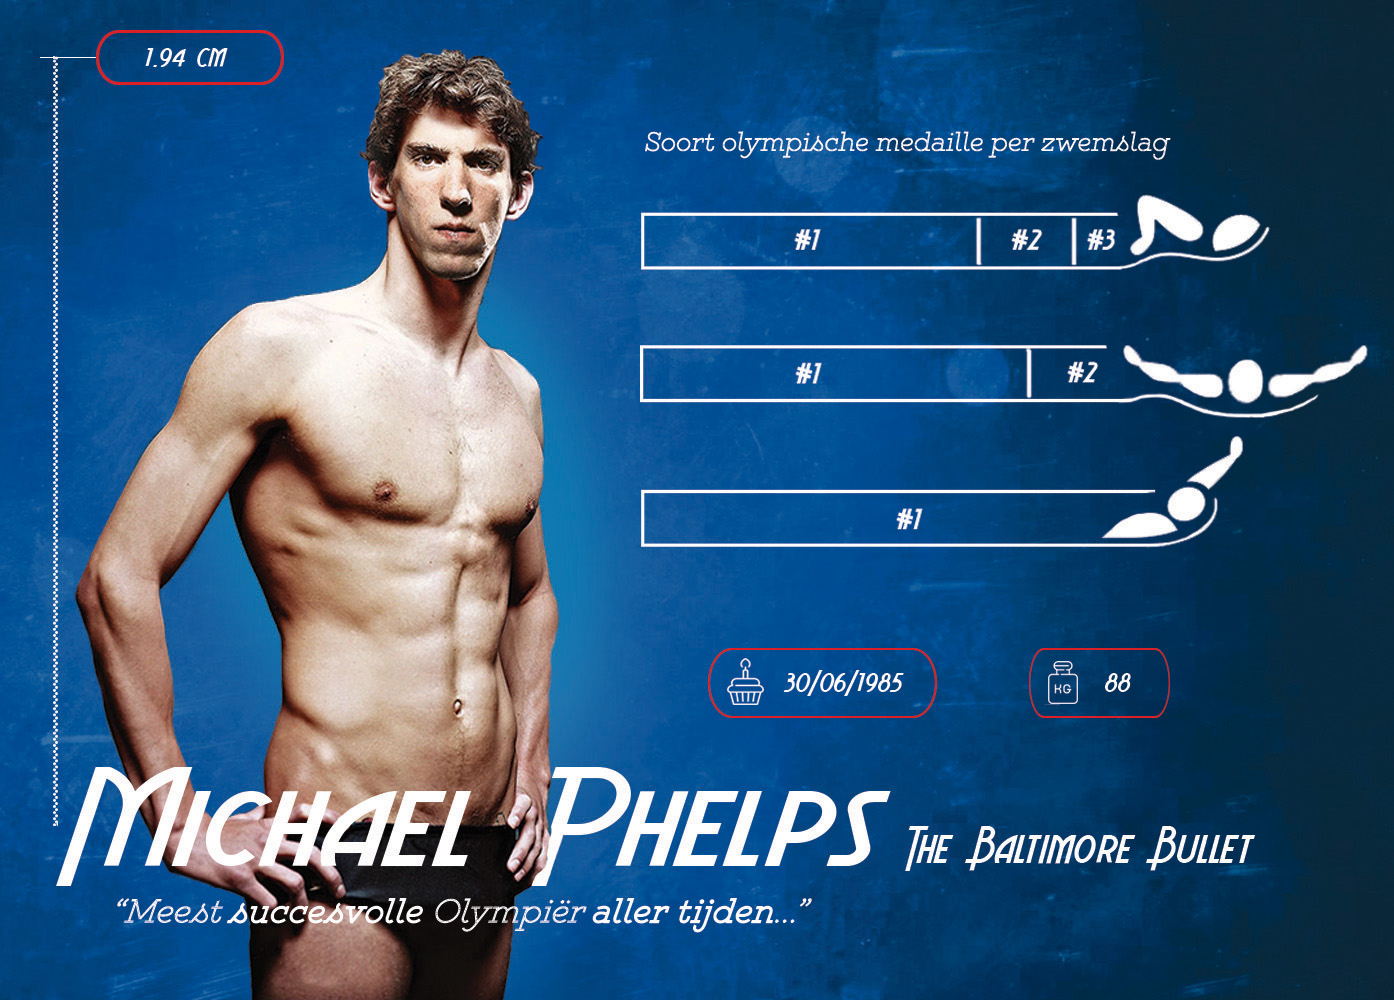
An infographic inspired by Michael Phelps, but with additional data. For this project we had to collect data related to swimming (in the Netherlands), and implement this data in an attractive infographic. The assignment started with choosing three concepts and brainstorming about them so that they could be turned into an identity for the infographic. Basic information on Michael Phelps was given to fill up the magazine spread, but the rest was based on data we collected ourselves and put into an infographic. I decided to show data on the number of swimming pools in the Netherlands and the demographic of people swimming.